Recent Findings
 Figure 1
|
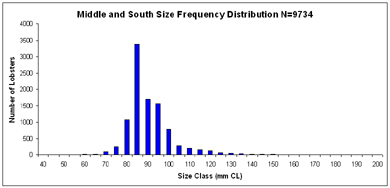 Figure 2
|
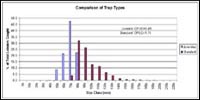 Figure 3
|
Catch Data
Size FrequencyAt Right are size frequency plots (Figures 1-2) generated for each area. Note that the y-axis is, showing abundance, varies between graphs. These figures are based on data from September 2001-November 2004, the number of lobsters (n) is shown on the figures.
The largest average sizes were observed in the four northern Gulf of Maine (GOM) study areas. There does not appear to be much difference between these four areas, except that there are very few sublegal lobsters in the Northern Canyons as compared to the other GOM areas. The Middle and Southern Canyons have the smallest average sizes and the shoal areas of these regions (Middle Shoals, and Southern Shoals) have slightly larger average sizes than the canyon regions. In the Middle Shoals and Canyons there is a distinct peak in abundance just below the minimum size (83mm or 3 1/4" CL) which is similar to that observed in inshore areas; all other areas had a more even distribution of abundances.
Trap Types
In order to best understand population size structure and recruitment, we must collect data on lobsters of all the sizes present in one area. Since traditional traps are designed to select for legal size lobsters we had to design a trap for sampling sublegal, juvenile lobsters. Six lobstermen were permitted to fish these modified traps, called juvenile collectors, and measure and report to us their catch before releasing the lobsters. The Figure 3 shows the sizes caught by the juvenile collector (blue) and standard trap (red). The juvenile trap successfully selects for small lobsters (legal size =83 mm CL).
 Figure 4
|
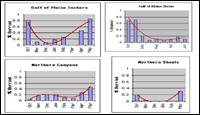 Figure 5
|
Berried Female Data
The size range of berried females differs between each of the areas. In Figure 4 North=Northern canyons+Northern shoals, Middle=Middle canyons+Middle shoals, South=Southern canyons+Southern shoals. Note that the minimum size is currently set at 83mm carapace length. There is an apparent difference between the size ranges of each area; there are few small berried females in the north and few large berried females in the south. This is probably indicative of a difference in size at maturity between these areas. See the table below and maturity section for more details.There appears to be an annual cycle of berried females such that there are peaks at certain times of the year (fall and late spring) in some areas. However, these peaks may not occur in all areas due to the migration of some females inshore to hatch their eggs in the summer and back offshore in the winter to take advantage of warmer temperatures in deeper water. For example, an observed decline in berried females inshore in the winter may be either the result of the timing of the female reproductive cycle or of migration offshore to take advantage of warmer temperatures in deeper water. Figure 6 shows graphs of the percent of females that are berried in each month of the year.
 Figure 6
|
 Figure 7
|
Maturity Data
Size at MaturityIt is important to determine the size at which female lobsters reach sexual maturity because one of the major means of management is based on this size. Managers create regulations in order to reach a goal of F10 egg production. "F10" is defined as 10% of the egg production of an unfished population and is considered to be the level of egg production necessary for a sustainable fishery. It is an estimate based on the number of berried females in the population and their relative reproductive contribution (in terms of number of egg produced). One of the main tools of regulation implemented to reach F10 has been the imposition of a minimum size limit. The purpose of implementing a minimum size is to allow 50% of females to reach sexual maturity before they can be legally landed. This insures that 50% of the females in the population will reproduce at least once before they are caught. Currently the minimum size is fixed at 3 1/4" (83mm) carapace length for the entire offshore fishery. However, the size at which females mature varies within the fishery, as seen below. This may be related to water temperature, food availability, density, or fishing pressure. We are investigating the relationship between bottom temperature and size at maturity to determine whether or not their is a relationship.
For each lobster dissected, the following protocol is followed:
- Measure carapace length and width of second abdominal segment.
- Cut off pleopod and determine molt stage and cement gland stage.
- Determine external molt stage.
- Check for presence spermatophore and examine under microscope.
- Cut open shell, remove eggs, cover up incision, return to tank.
- Stage eggs under microscope.
Summary of Berried Female and Maturity Assessment Data
NORTH:Average size of berried females : 114 mm CLRange: 85-190 mm CL Total Berried: 1012 Size at Maturity Size at 50% maturity: 92 mm CL Smallest Mature: 71 mm CL Temperature Degree Days >80C: 234 Temp Range: 4-140C |
MIDDLE:Average size of berried females : 97 mm CLRange: 71-155 mm CL Total Berried: 1161 Size at Maturity Size at 50% maturity: 82 mm CL Smallest Mature: 71 mm CL Temperature Degree Days >80C: 999 Temp Range: 7-140C |
SOUTH:Average size of berried females : 90 mm CLRange: 78-115 mm CL Total Berried: 106 Size at Maturity Size at 50% maturity: 79 mm CL Smallest Mature: 71 mm CL Temperature Degree Days >80C: 808 Temp Range: 6-140C |
Using the Ratio of Abdomen Width to Carapace Length to Determine Maturity
The ratio of abdomen width (Figure 7) to carapace length (ABD/CL) increases as a female reaches sexual maturity. Click here for abdomen width pictures description. We measured the abdomen widths and carapace lengths of males and females, both berried and non-ovigerous. Note the divergence of the female ABD/CL from that of the male as the females approach maturity. The ratio measured for berried females aligns with the top part of the non-ovigerous female curve where 100% of females are assumed to be mature. This serves as a good check on this method. Also plotted (green x's) are the percent of females (secondary y-axis) in a given size class that we determined by dissection to be mature. Note that the high percentages of mature females also fall on the top part of the curve.
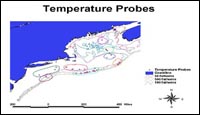 Figure 8
|
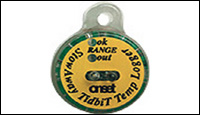 Figure 9
|
 Figure 10
|
 Click to play video
|
Temperature Data
Temperature Probes
Each purple dot on Figure 8 shows the position of a Tidbit Temperature Logger. Temperature probes are grouped into the same areas used for catch data in order to compare the temperatures between areas. The areas circled are as follows (from north to south): PINK=Gulf of Maine inshore, LIGHT GREEN=Gulf of Maine basin, DARK BLUE=Northern shoals, ORANGE=Northern canyons, RED=Middle shoals, LIGHT BLUE=Middle canyons, DARK GREEN=Southern shoals, PURPLE=Southern canyons.
This datalogger (Figure 9) is attached to a lobster trap and records bottom temperature. Periodically the Tidbit is detached and replaced with a new one. Our temperature data collection is in collaboration with the eMolt project, headed by Jim Manning. To see more about the eMolt project go to: www.emolt.org
Annual Bottom Temperature Cycles
Annual temperature cycles for each area described above are shown in Figure 10. The blue lines represent data estimated by a program called TempEst, developed by David Mountain at WHOI, and the pink lines represent data collected by Tidbit probes. The TempEst data typically aligns with our Tidbit data very well. The depths from which data are taken differ between areas, so variation may be due to both depth and location. However, note that the bottom temperature in offshore areas rarely falls below 8C and that the seasonal variation in deeper water is minimal.
Annual Sea Surface Temperatures
To Right: is a Quicktime video produced from NOAA SST data that shows the influx of warm water from the gulf stream over the year. This gives a sense of the potential bottom temperature differences between the above described areas. Double-click on the picture to start playing.
 Figure 11
|
 Figure 12
|
Lobster Migration
Lobsters are mobile animals that may travel short distances in search of food or may migrate long distances in search of warmer waters to enhance the growth and development of their eggs and of themselves. It is thought that approximately 20% of the offshore lobster population undertake long distance seasonal migrations towards shoaler waters in the summer and back to deeper waters in the winter in order to maximize their thermal exposure (Cooper, 1977). We are taking this into consideration when looking at the possible effects of temperature on the size at maturity of female lobsters from different areas.Figure 11 is a map which is a composite of several tag and recapture studies that looked at this migratory behavior. Each line represents a path of at least one lobster.
Estimate of Thermal Exposure of Migrating vs. Stationary Lobsters
Figure 12 illustrates the thermal exposure gained by a lobster that migrates inshore in the summer months and back offshore in the winter. The data from this graph came from the TempEst program and represents the area near Hudson Canyon, in the canyon (offshore) and just south of Long Island (inshore). These are two ends of a probable migration path as indicated on the map above.
Migration Paper References
Campbell, A. 1983. Growth of Tagged Lobsters (Homarus americanus) Off Port Maitland, Nova Scotia 1948-1980. Can. Tech. Rep. Of Fish. And Aquat. Sci. No. 1232: 1-10.
Cooper, RA. 1977. Ecology of shallow and deep water American lobsters (Homarus americanus) from the New England continental shelf. CSIRO Div. Fish. Oceanogr. (Aust.) Circ. 7: 27-28.
Cooper, R. and Uzmann, J. 1971. Migrations and Growth of Deep-Sea Lobsters, Homarus americanus. Science 171: 288-290.
Dow, R.L. 1974. American lobsters tagged by Maine commercial fishermen 1957-59. Fishery bulletin of the Fish and Wildlife Service. 72: 622-623.
Fogarty, M.J., Borden D.V.D., and Russell, H.J. 1980. Movements of Tagged American Lobster, Homarus americanus, Off Rhode Island. Fishery Bulletin 78(3): 771-780.
Krouse, J. 1981. Movement, Growth and Mortality of American Lobsters, Homarus americanus, Tagged Along the Coast of Maine. NOAA Technical Report NMFS SSRF-747.
Morrissey, T.D. 1971. Movements of Tagged American Lobsters, Homarus americanus, Liberated off Cape Cod, Massachusetts. Trans. Amer. Fish. Soc., 1: 117-120.
Pezzack, D.S. and Duggan, D.R. 1986. Evidence of Migration and Homing of Lobsters (Homarus americanus) on the Scotian Shelf. Can. J. Fish. Aquat. Sci. 43: 2206-2211.
Saila, S.B. and Flowers, J.M. 1968. Movements and behavior of berried female lobsters displaced from offshore areas to Narragansett Bay, Rhode Island. Journal du Conseil. Conseil international pour l'Exploration de la Mer 31: 342-350.
